01a Introduction to Biostatistics
Course: “Biostatistics”
Translational Neuroscience
Welcome!
Hello!
Who am I?
Who are you?
What is your background?
Do you have experience with data analysis?
What’s your attitude towards statistics?
Using the Slides
- These slides are created directly in R with the quarto extension.
- You can jump to a slide by clicking the three dashes in the bottom left.
- You can conveniently copy R code from the slides with one click and paste it into your RStudio.
Organizational Issues
Attendance is mandatory! (I don’t make the rules :) )
You may miss one session without giving reasons (recommendation: don’t waste it early!)
If you miss additional sessions, please write an email with an explanation (further proof may be required, e.g. doctor’s certificate)
The course will take place in person
- Only for students who are not in Würzburg yet, there is an option via Zoom
We will use these textbooks (Open Educational Resources - freely available online, also linked in WueCampus):
For the R part: Fundamentals of Quantitative Analysis
(Additional Resource: R for Data Science)
Contents
- From basic probability to (Generalized) Linear Mixed Models
- Some things may be repetitive for you but this course aims to provide a common starting position for your next semesters
- Input (lecture style) with hands-on R sessions
- In addition, you should read a few pages in the text books
(Statistical Thinking for the 21st Century, and possibly Fundamentals of Quantitative Analysis) - Project: Independently analyze a dataset (exam with pass or fail grading)
Project
Find a dataset that can answer a question you are interested in
- https://ourworldindata.org/
- Statistisches Bundesamt
- Your own, e.g., from an internship
preprocess/wrangle it,
analyze the data,
and write a short (min. 2-page) report!
- short intro incl. research question and hypothesis
- methods (both how the data were acquired and how they are analyzed)
- results (incl. at least one plot)
- and a short discussion.
- All these parts should be at least half a page long.
Schedule
The up-to-date version can be found at https://spressi.github.io/biostats/
| Date | Topic | Reading | Lecturer | Project Deadlines |
|---|---|---|---|---|
| 16.10. | General & R Intro | ST21: 1-3, QF: 1-3 | Reutter | R & RStudio installed |
| 23.10. | Probability | ST21: 4, QF: 4-6 | Hildebrandt | |
| 30.10. | Data Wrangling | ST21: 4, QF: 4-6 | Reutter | |
| 06.11. | Data Visualization | QF: 7 | Reutter | |
| 13.11. | Sampling | ST21: 7-8, QF: 8 | Hildebrandt | Dataset |
| 20.11. | Penance Day | |||
| 27.11. | Probability & Sampling in R | ST21: 7-8, QF: 8 | Hildebrandt | |
| 04.12. | Hypothesis Testing | ST21: 9-10 | Reutter | |
| 11.12. | Comparing Means & Categories | ST21: 12, 15 | Reutter | Research Question & Hypotheses |
| 18.12. | Exercises (t-Tests, Chi²) | ST21: 12, 15 | Reutter | |
| 25.12. & 01.01. | Christmas & New Year’s | |||
| 08.01. | (General) Linear Models | ST21: 12-13 | Hildebrandt | First Analysis Ideas |
| 15.01. | Exercises (GLM) | ST21: 12-13 | Hildebrandt | |
| 22.01. | Linear Mixed Models | ST21: 14 | Hildebrandt | Analysis (with R scripts) |
| 29.01. | R Markdown for Reports | Reutter | ||
| 05.02. | Troubleshooting Your Report | both | Send Questions via Email | |
| 12.02. | Report (with R Markdown) |
Why Statistics?
Why is it important that YOU know statistics?
You’re doing a research master!
- Research = Reading & understanding papers (esp. the analyses)
- Designing your own experiments, analyze data, interpret results
We live in an increasingly data-centric world
- Knowing how to wrangle and analyze data is a valuable skill
Facts & data literacy matter more than ever!
Fake News, “Lying with stats”, Reproducibility Crisis
Being able to call bullshit (https://www.callingbullshit.org/)
“I only believe in statistics that I doctored myself” ― Winston S. Churchill
- However: “It is easy to lie with statistics, but easier to lie without them” ― Frederick Mosteller
What is Statistical Thinking?
“a systematic way of thinking about how we describe the world and use data [to] make decisions and predictions, all in the context of the inherent uncertainty that exists in the real world.” (Poldrack, Preface of ST21)
“Statistical thinking is a way of understanding a complex world by describing it in relatively simple terms that nonetheless capture essential aspects of its structure or function, and that also provide us some idea of how uncertain we are about that knowledge.” (Poldrack, Chapter 1)
Why is Statistical Thinking Important?
- data literacy vs. intuition/heuristics/anecdotal evidence
- Public discourse about Covid-19, migration, etc. (e.g., “50% of people in intensive care are vaccinated”)

What can Statistics Do For Us?
Describe patterns by summarizing/breaking down data (“descriptive statistics”)
Decide whether one thing is better than another, given the uncertainty (“inferential statistics”)
Predict how other people would “behave” (generalize to new observations)
The Big Ideas
Learning from data: Update our beliefs
Aggregation: How to summarize the data to draw meaningful conclusions?
Uncertainty: Probabilistic evidence
Sampling from the population: Which people etc. do we select?
Causality
Correlation does not imply causation… but is a hint!
Example: Smoking = less risk for Parkinson’s disease? (Godwin-Austen et al., 1982; Chen et al., 2010)
→ confounding factors?
e.g., individual dopaminergic activity ⇒ addiction & motor function
Randomized Controlled Trials (RCT) as the solution?
What are Data?
- What do you think are data?
qualitative vs. quantitative
qualitative?
- open questions, descriptions… can potentially be coded into categories
quantitative?
- numeric, can be averaged etc.
What are Data? (2)
Data types
character/string: text (qualitative)
factors/categories
types of numbers (quantitative)
binary: 0 or 1, TRUE or FALSE (logical)
integers: whole numbers
real numbers: decimals/fractions
discrete vs. continuous
discrete: finite set of particular values (0 or 1, scale from 1 to 10)
continuous: real numbers that fall into particular range (e.g., brain activity, visual analoge scale)
What data type is eye color?
What is a Data Set?
a collection of data
usually organized into rows and columns (like an excel spreadsheet)
rows: participants/animals/cells…
columns: variables!
- each variable contains one type of measurement
table cells = unique observations of variables per participant etc.
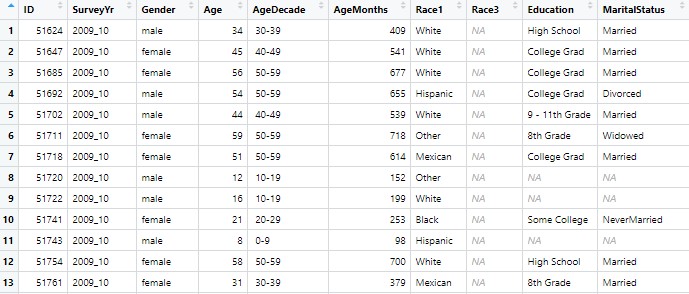
NHANES dataset
What Makes a Good Measurement?
What is being measured?
constructs vs. proxies: need to be well-defined! (Difficult)
measurement error
random: e.g., variation in reaction times of same participant across trials
systematic: e.g., miscalibrated eye-tracking device
Do we have a “gold standard” to compare the measurement to?
Reliability
Correlation of a measurement with “itself”
Internal reliability (consistency)
Test-retest reliability (stability)
Inter-rater reliability (agreement)
Correlation with other variables can’t be higher than reliability (cf., Wilmer et al., 2012, Table 1)!
Validity
Are we measuring the construct we’re interested in?
Face validity: Does it intuitively make sense? First reality check!
Construct validity
convergent validity: Related to similar measures that should measure the same construct
divergent validity: Is it unrelated to other measures?
Predictive validity: Is it predictive of other outcomes? (e.g., intelligence & job success)
Validity & Reliability
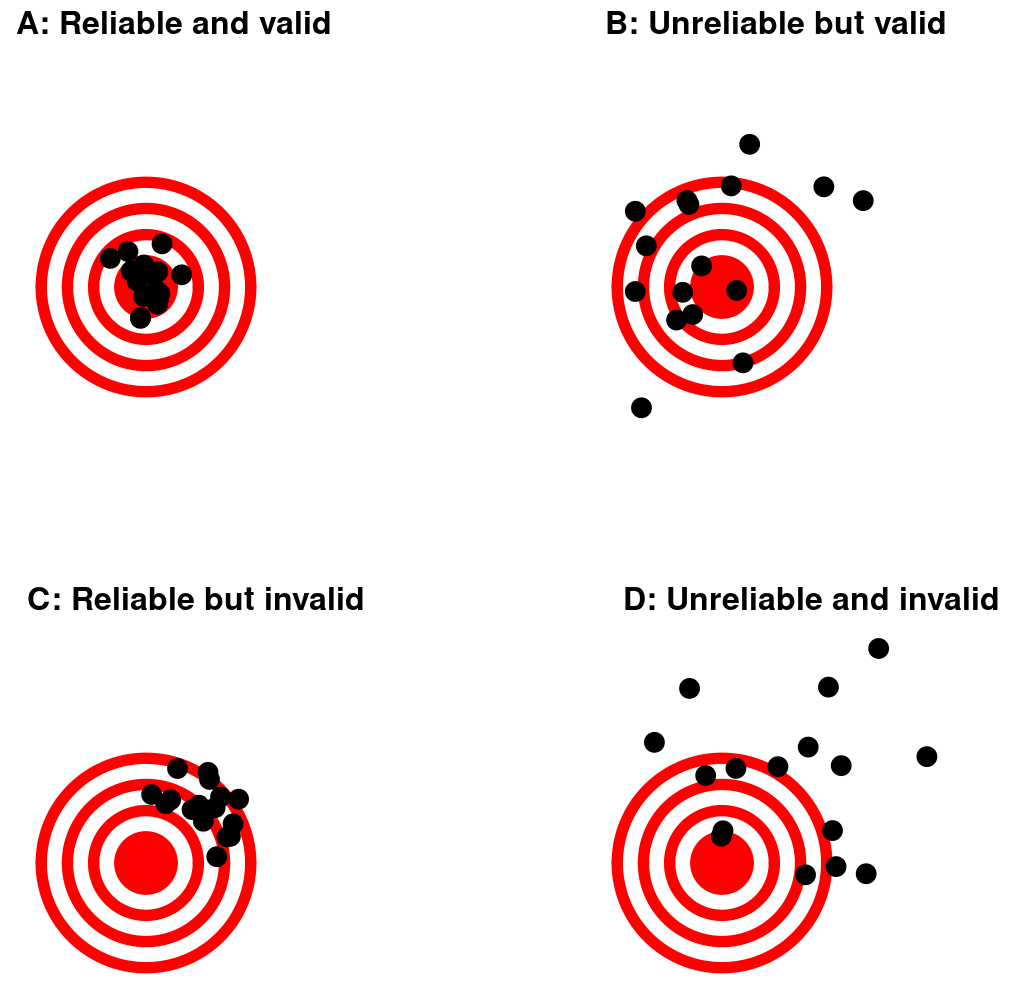
Reliability & Validity
Summarizing Data
Throwing away (some of the) information!
extract the quintessence of the data (important for forming models)
make predictions
Counts, frequencies, percentages, averages
Thanks!
Learning objective today:
Why is statistics important?
What are data?
What is reliability and validity?
Next:
R session: “Intro to R”
- please install R & RStudio!
Installation tutorial: https://learningstatisticswithr-bookdown.netlify.app/intror
You can also already install Rtools, which will be needed later: https://cran.r-project.org/bin/windows/Rtools/
- please install R & RStudio!
Theory: Models