Paradigms that produce robust results often show low reliability (Hedge et al., 2018)
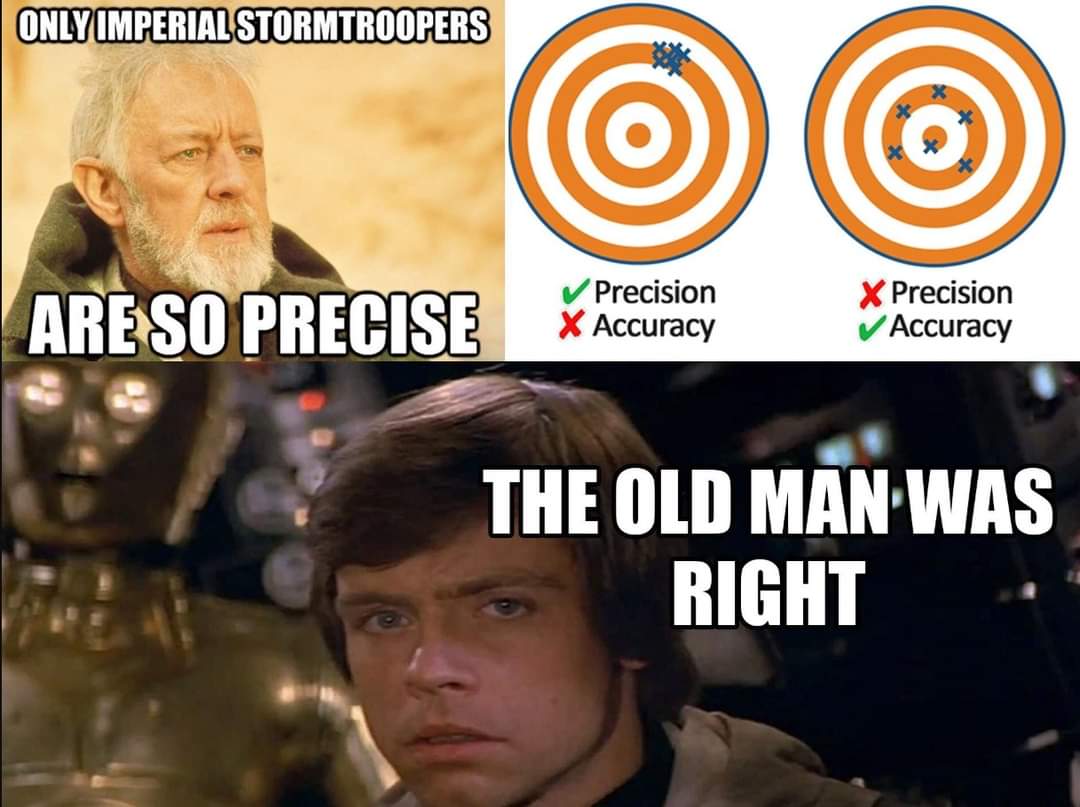
Why do statistical significance and reliability not go hand in hand?
Reliability Paradox
Paradigms that produce robust results often show low reliability (Hedge et al., 2018)
Why do statistical significance and reliability not go hand in hand?
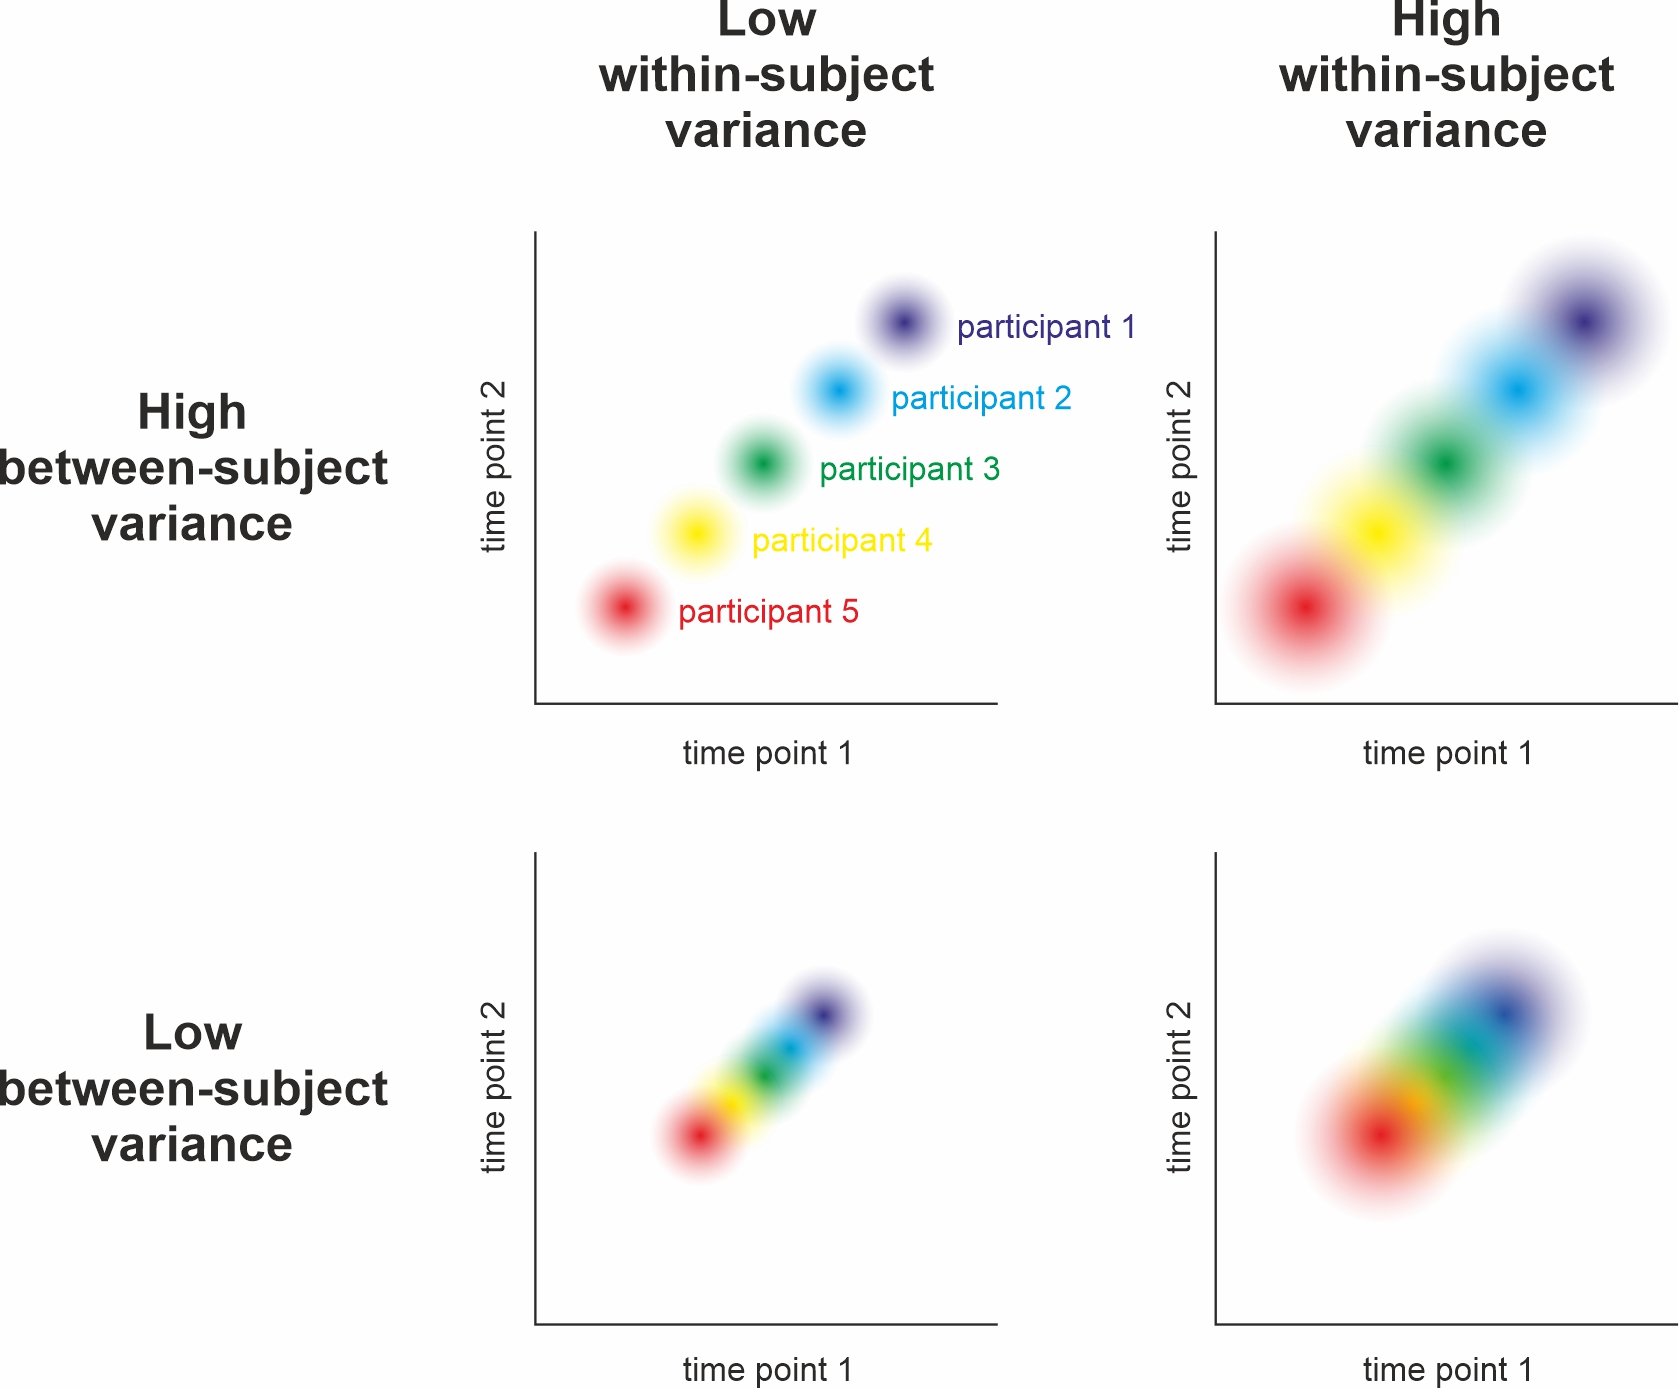
Statistical power is enhanced by high group-level precision,
reliability by high group-level variability (cf. previous slide)
More subjects only increase group-level precision (high power), leaving subject-level precision constant → sample size has no effect on the magnitude of reliability
→ Choosing your paradigm and sample, you can optimize for group-level significance OR reliability
Basic research favors different things than (clinical) application (or individual differences research)
⇒ Most of the time group-level precision gets optimized at the cost of reliability
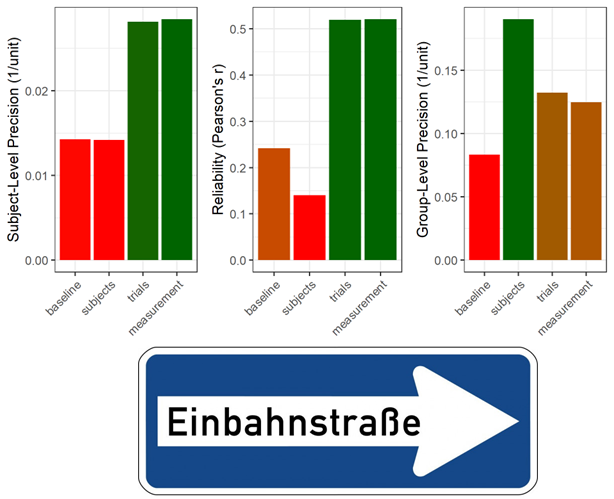
Trial-Level Precision to the Rescue!
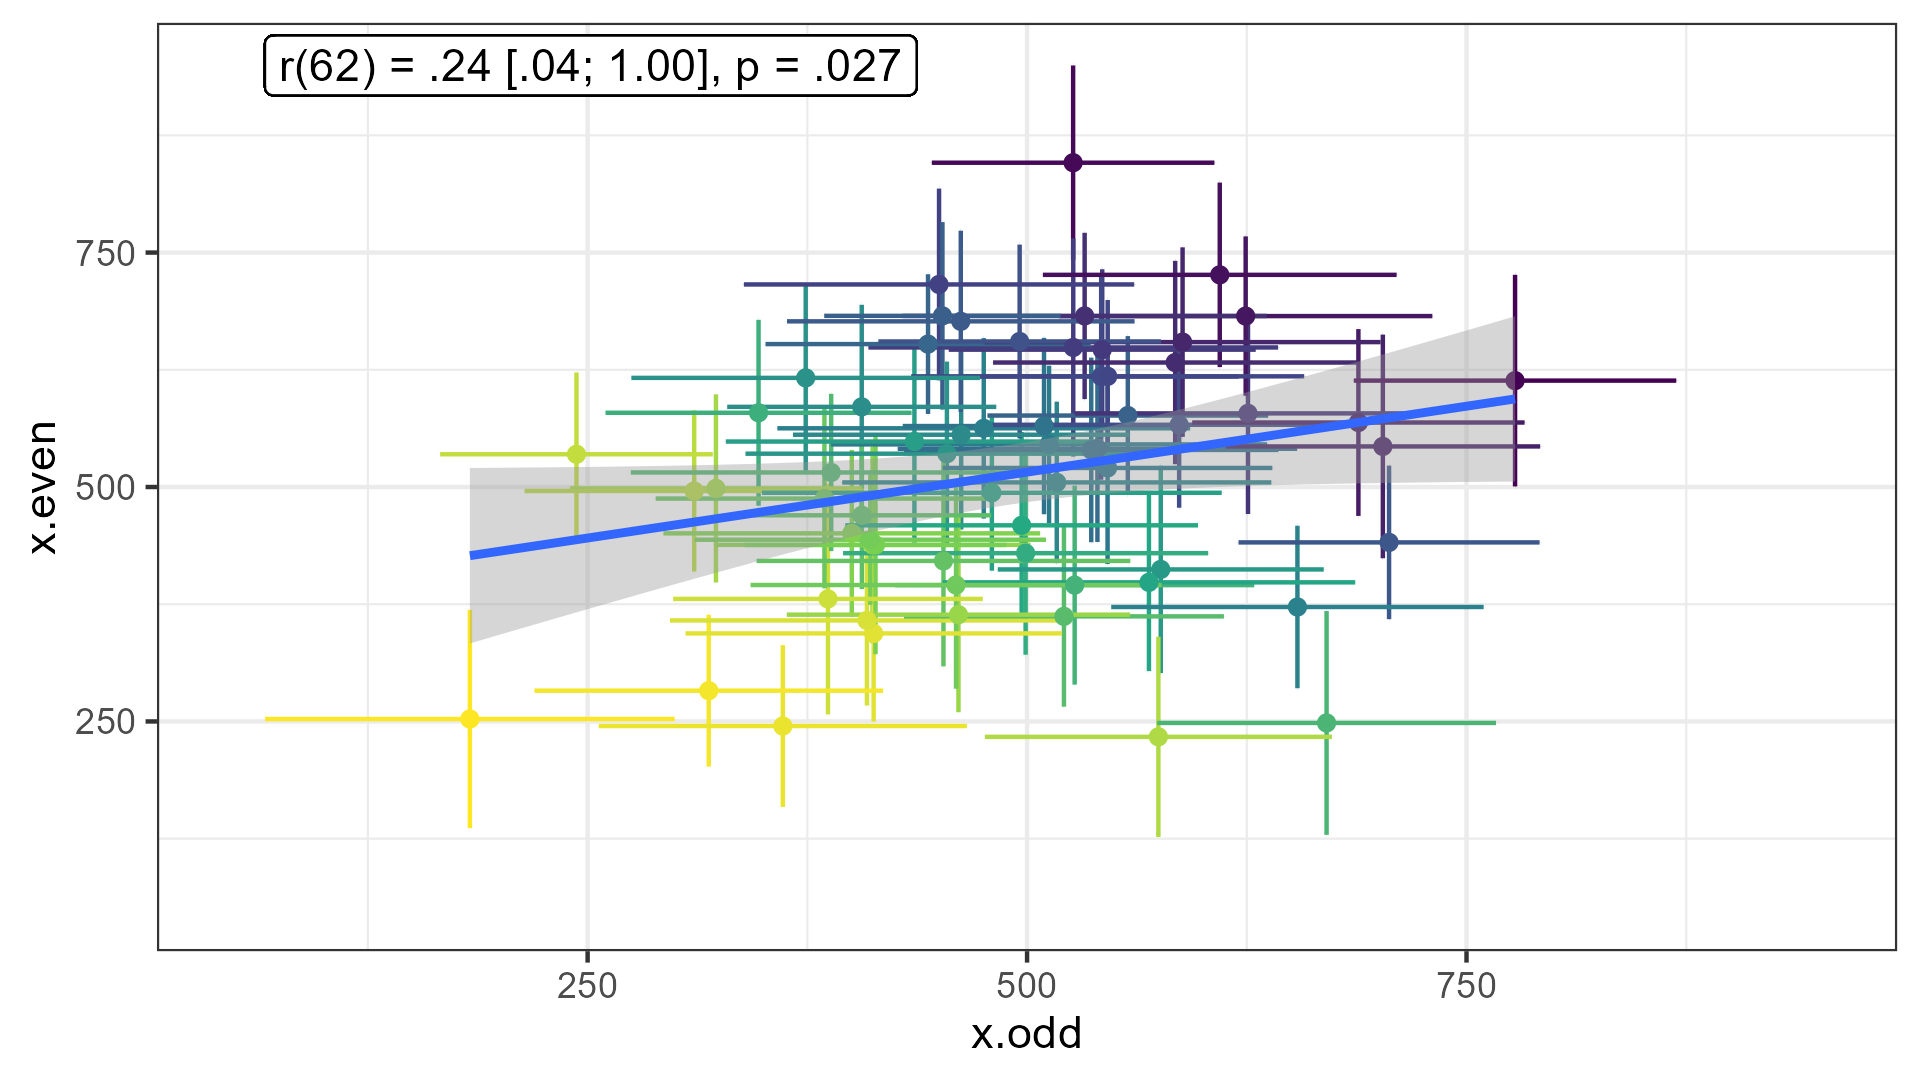
Improving trial-level precision of the measurement benefits both subject- and group-level precision
⇒ Nested hierarchy of precision
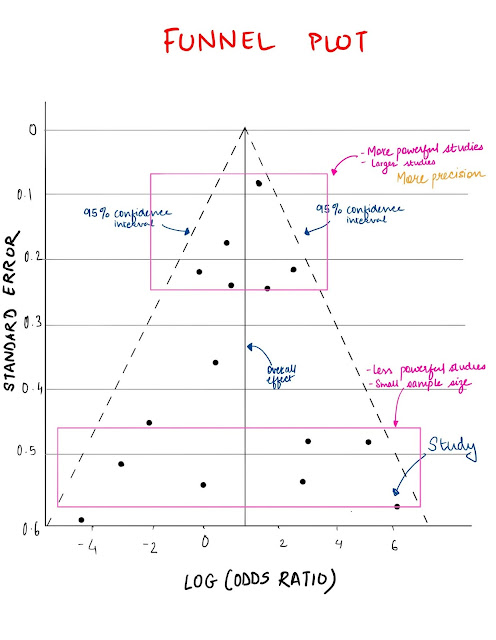
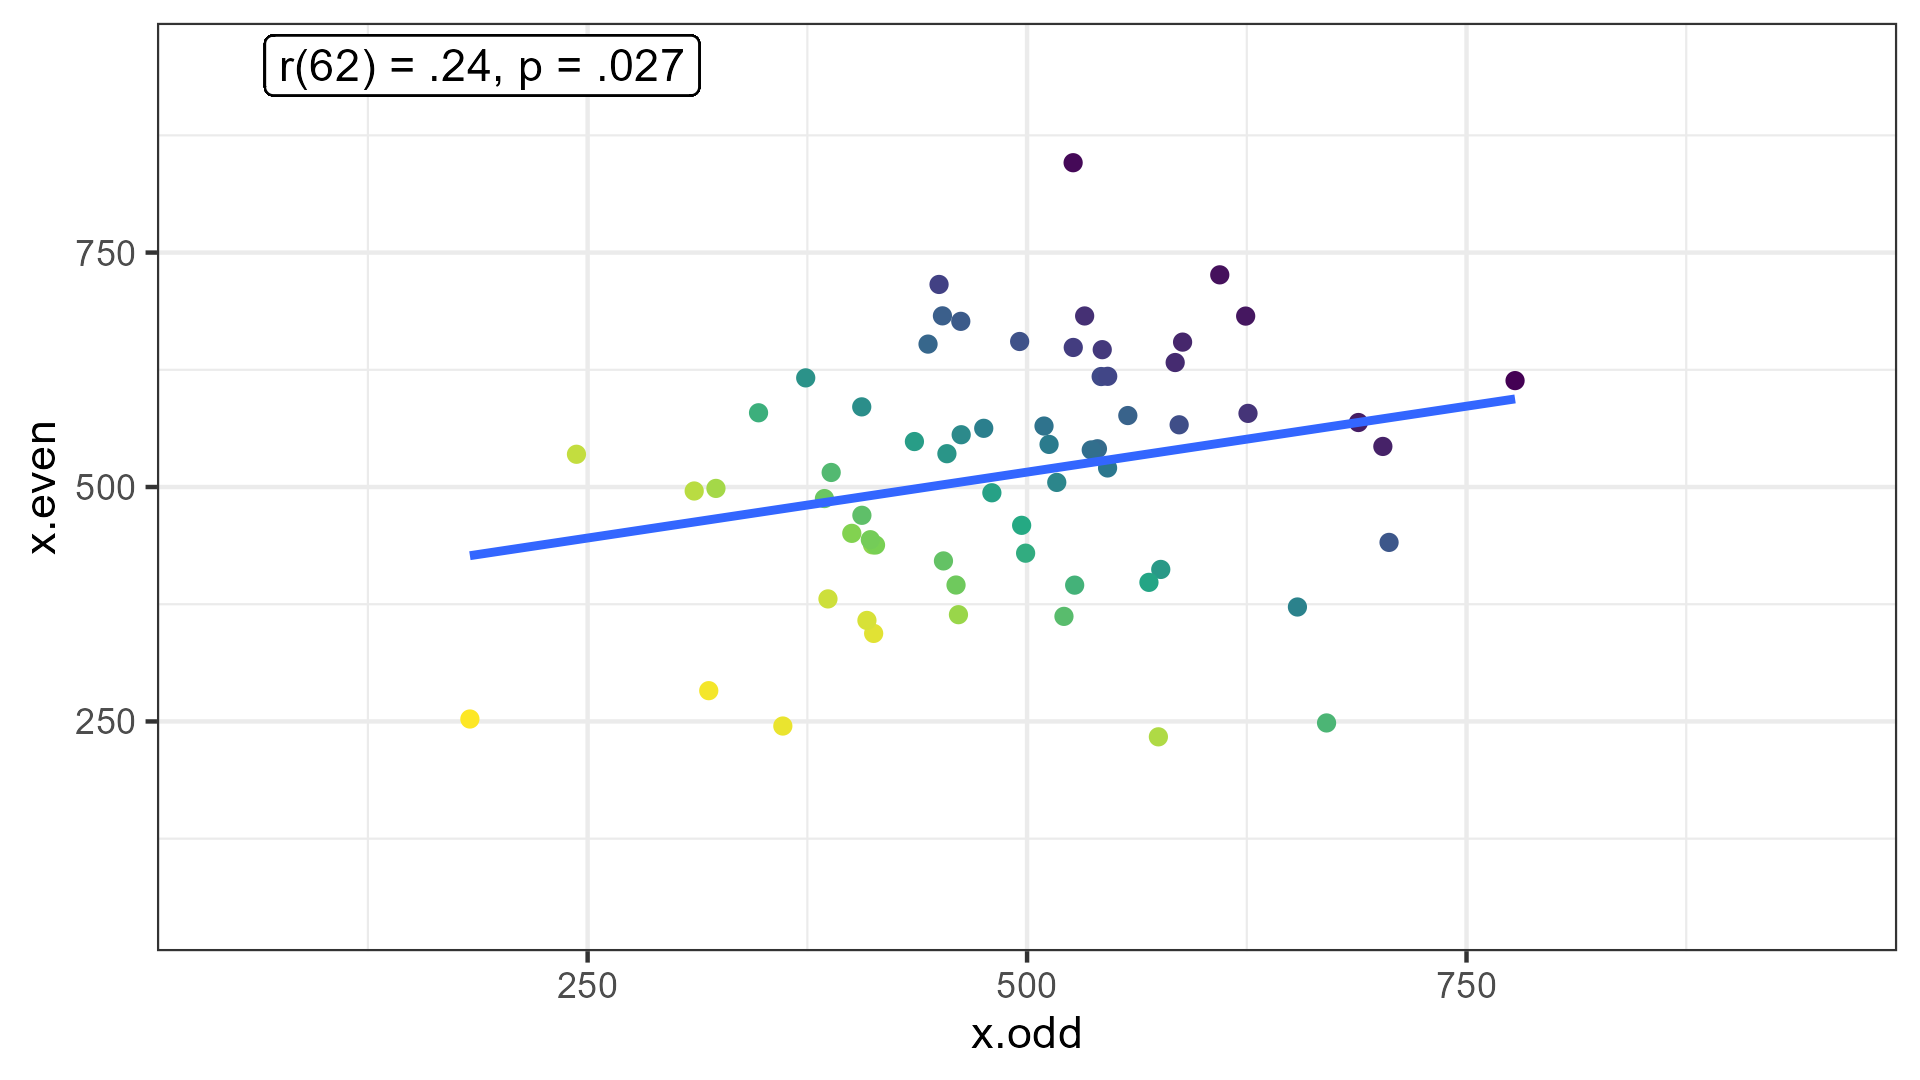
Precision is indicated by errorbars / confidence intervals
Whenever you summarize across a variable, you can calculate the precision of the aggregation
Precision exists on different levels: group, subject, trial (and more)
Closely linked to statistical power and reliability
How Can We Enhance Precision?
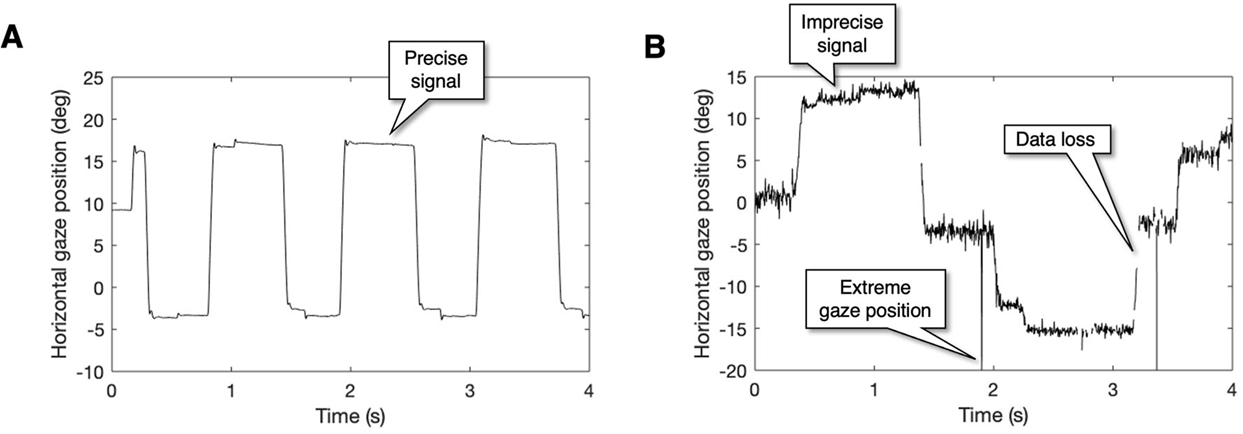
Shield the measurement from random noise → precise equipment / paradigm
⇒ trial-level precision
Identify the aggregation level of interest:
sample differences → optimize group-level precision:
many subjects that respond homogenously
correlational hypotheses / application → optimize subject-level precision:
systematic differences between individuals but little variability within subjects across many trials (mind “sequence effects”; cf. Nebe, Reutter, et al., 2023)
⇒ “two disciplines of scientific psychology” (Cronbach, 1957)
Group- vs. Subject-Level Precision
Group-level Precision
Group differences (t-tests, ANOVA)
Many subjects (independent observations)
Homogenous sample (e.g., psychology students?)
Subject-level Precision
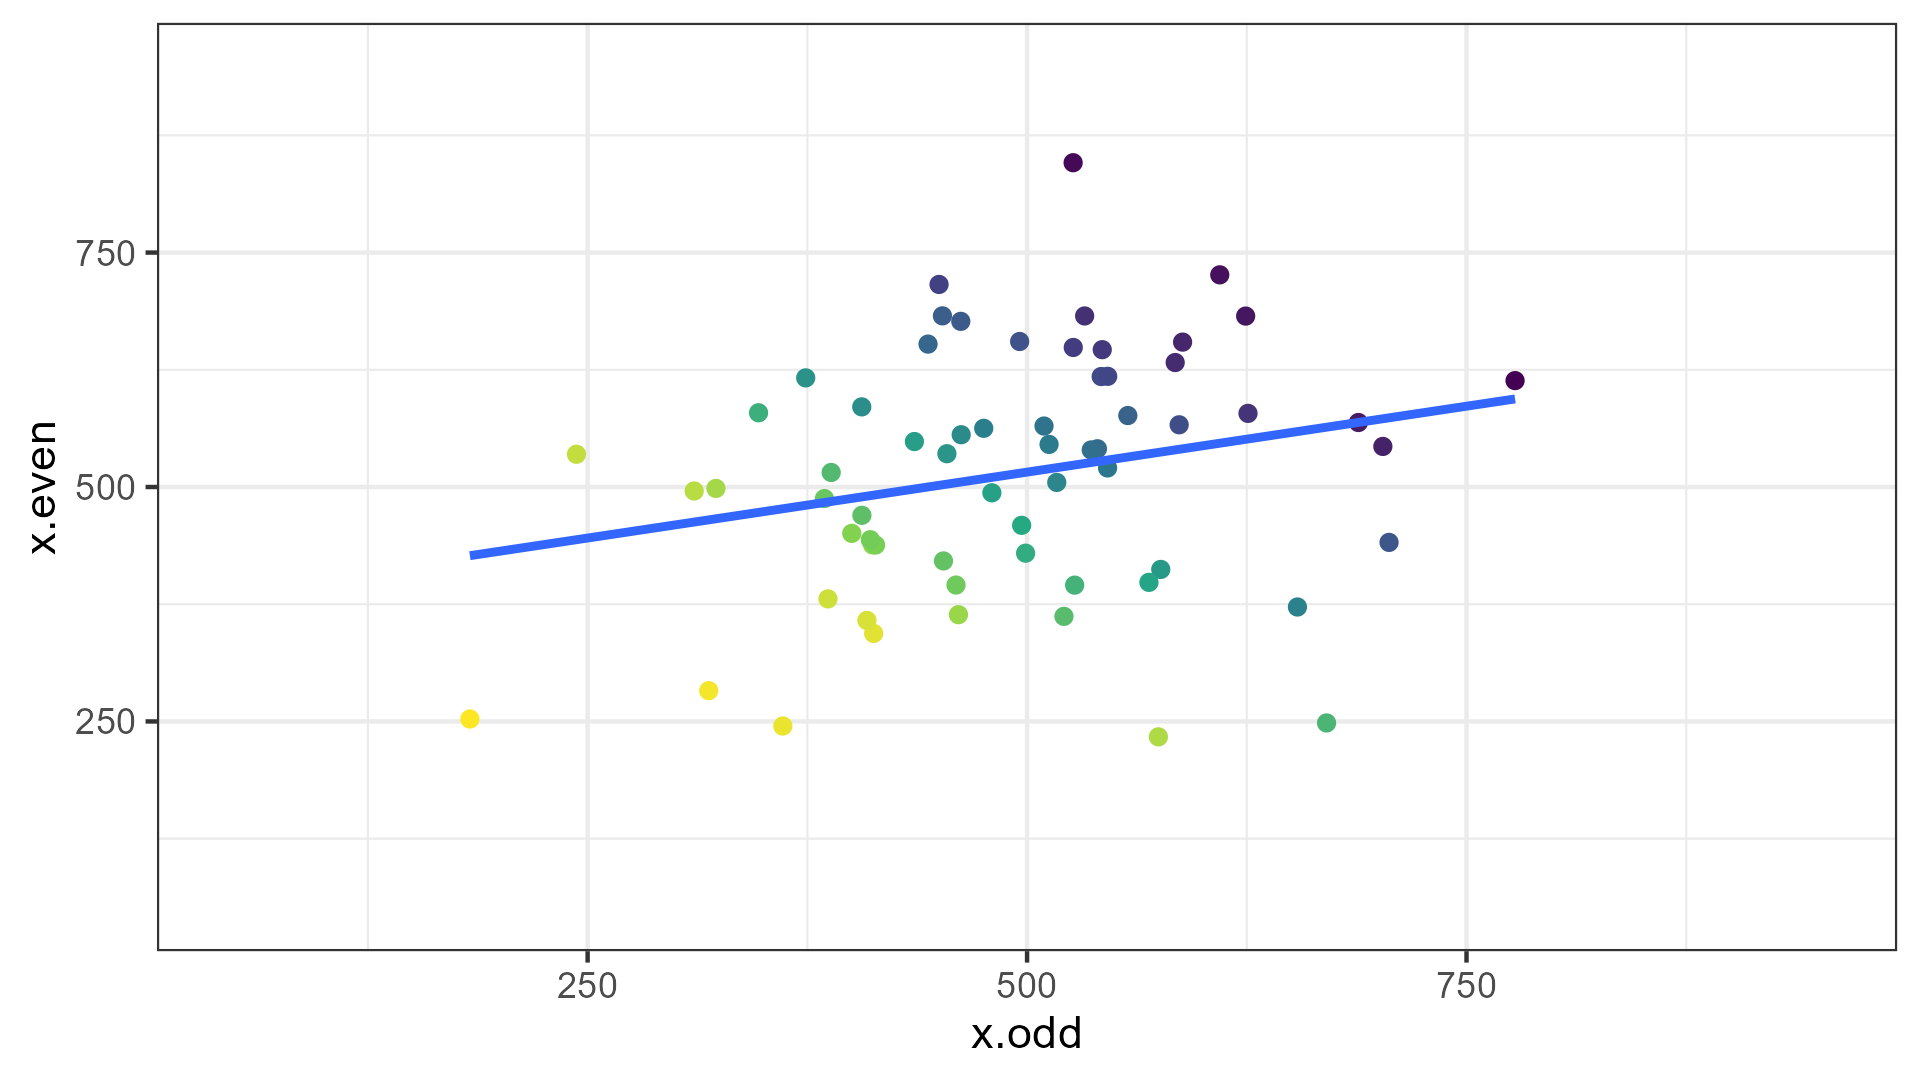
Correlations (e.g., Reliability)
Many trials (careful: sequence effects!)
Heterogenous/diverse sample
Low variability within subjects across trials (i.e., SDwithin)
Take Home Message
We are in a replication crisis
Increasing the number of subjects is not the only way to get out
Sample size benefits basic research on groups only
⇒ Increase precision on the aggregate level of interest!
Precision in R!
The Standard Error (SE)
Calculates the (lack of) precision of a mean based on the
standard deviation (\(SD\)) of the individual observations and their number (\(n\))
\[SE = \frac{SD}{\sqrt{n}}\]
The Standard Error (SE) in R
No base R function available 💩
Use confintr::se_mean (not part of the tidyverse)
Use a custom function
se <-function(x, na.rm =TRUE) {sd(x, na.rm) /sqrt(if(!na.rm) length(x) elsesum(!is.na(x)))}
The Standard Error (SE) in R 2
Whenever you use mean, also calculate the SE:
library(tidyverse)iris %>%#helpful data set for illustrationsummarize( #aggregation => precisionacross(.cols =starts_with("Sepal"), #everything(), #output too wide.fns =list(mean = mean, se = confintr::se_mean)),.by = Species)